DRAFT
Perhaps the first attempts to visualize smog and/through its effects ocurred in Los Angeles in the first few post-world War II years. This is done by a small group of actors, working almost entirely under the auspices of two institutions: 1) the Stanford Research Institute (SRI), just starting to establish itself as the largest and most influential "think tank" of the Cold War University-Military Industrial Complex; its air pollution work was sponsored by the Western Oil and Gas Association, and 2) the Los Angeles County Air Pollution Control Board.
MORE TO COME

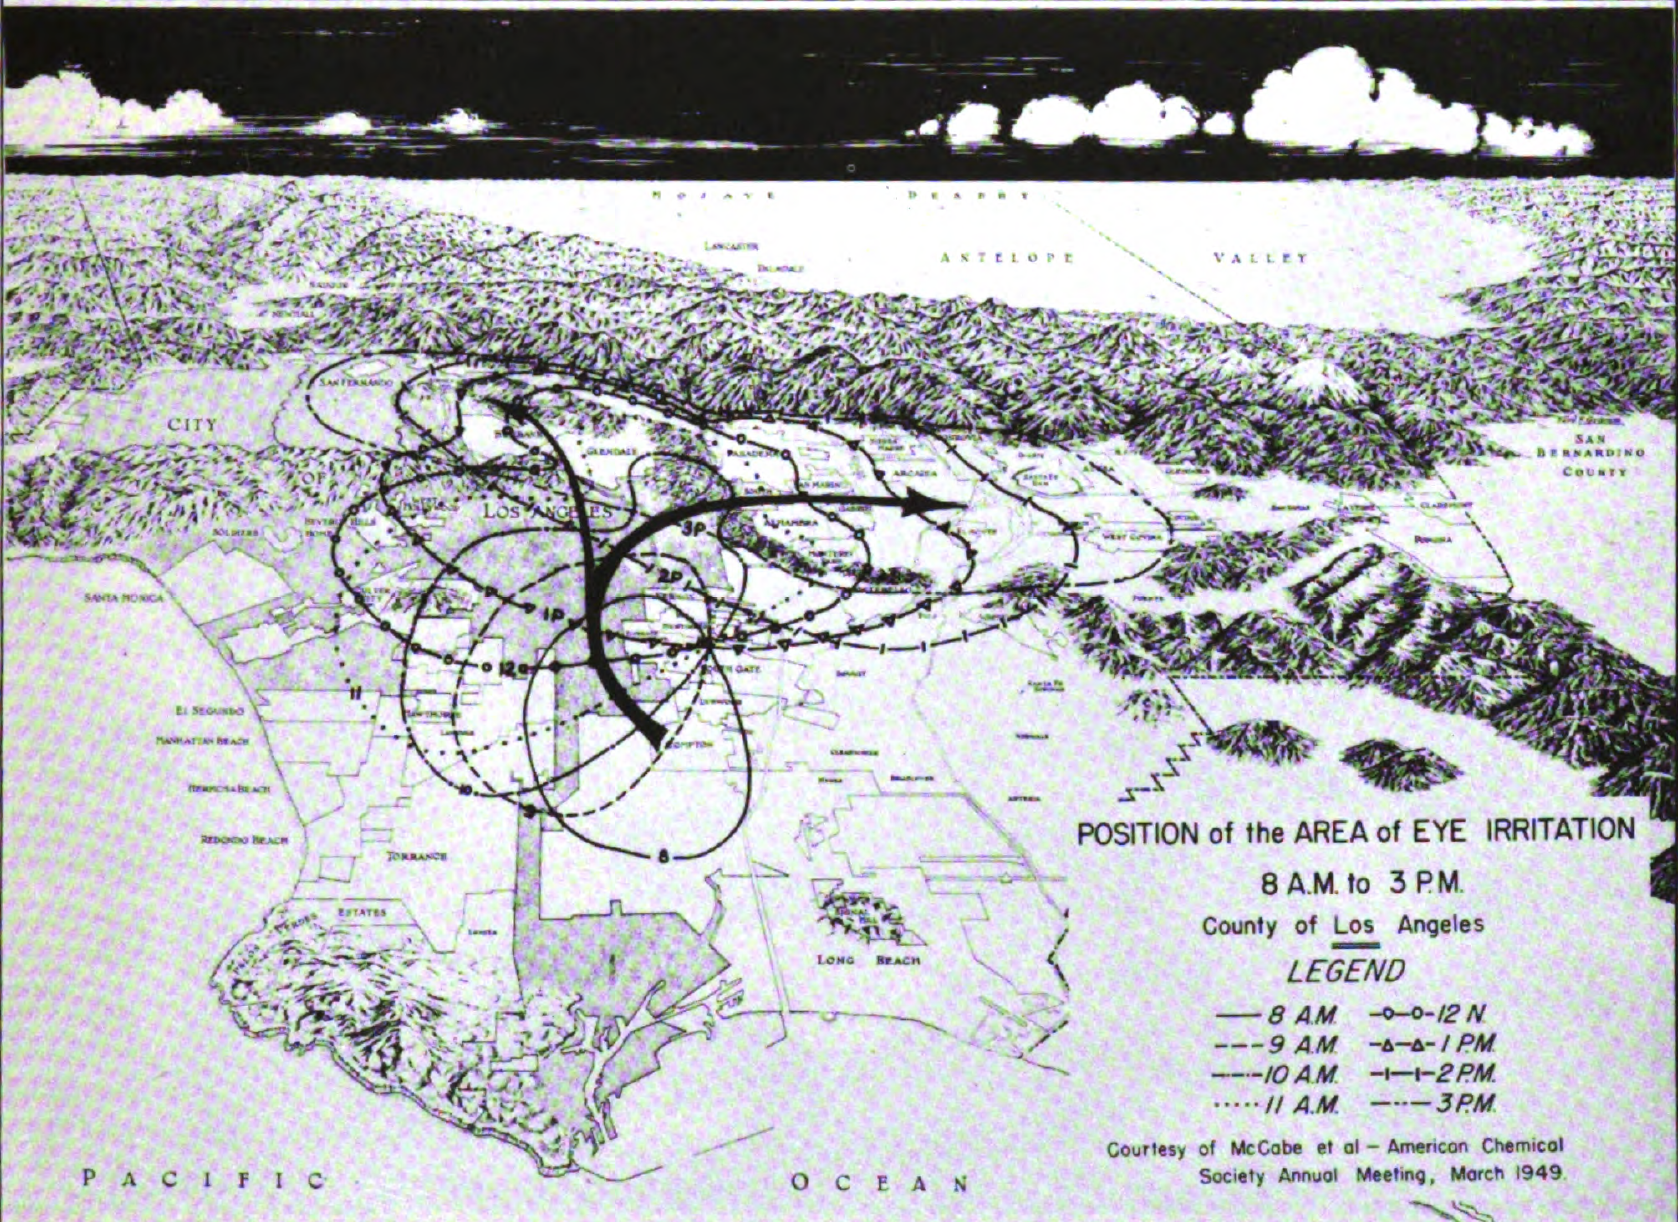
Early efforts at visualizing air pollution trace back to the eye -- eyes, more accurately, in human bodies distributed throughout Los Angeles County communities. It's all about the eyes -- as bio-indicators, and as site of toxic action -- not the lungs. The first and at the time only physiological effect of smog that was mapped was eye irritation. This geography of eye irritation resembles a topographic map, or a map of barometric pressure -- not surprisingly, given that meteorological data ws the most collected and readily available data there was. A moving zone of "lachrymation" is tracked over the course of a day, as it slowly shifts north and east, into the San Fernando Valley and towards San Bernardino. The source, or at least the origin of the arrow and the center of the earliest 8 a.m. irritation circle, is Compton.

Data like this was used to construct visualizations like that in the previous image. The SRI researchers decided that blink rate was the most objective measure of eye irritation.

The SRI researchers used seemingy insane devices such as this to measure blink rates. Polluted air of varying degrees and composition is presumably pumped into those goggles via the black tubes running down his chest, while the photometer attached to the left goggle eye registers the blink -- no Geertzian ambiguity or interpretability here, no sir...
Mike Fortun. 26 January 2020, "Smog: Visualizations, Effects c. 1949", Center for Ethnography, Platform for Experimental Collaborative Ethnography, last modified 27 January 2020, accessed 26 December 2024. http://centerforethnography.org/content/smog-visualizations-effects-c-1949
