Stanford Research Institute and Western Oil and Gas Association. The Smog Problem in Los Angeles County: Second Interim Report on Studies to Determine the Nature and Sources of the Smog. Los Angeles: Committee on Smoke and Fumes, Western Oil and Gas Association, 1949. https://catalog.hathitrust.org/Record/102203236
Anonymous, "eye irritation 1949", contributed by Mike Fortun, Center for Ethnography, Platform for Experimental Collaborative Ethnography, last modified 28 February 2020, accessed 26 December 2024. http://centerforethnography.org/content/eye-irritation-1949
Critical Commentary
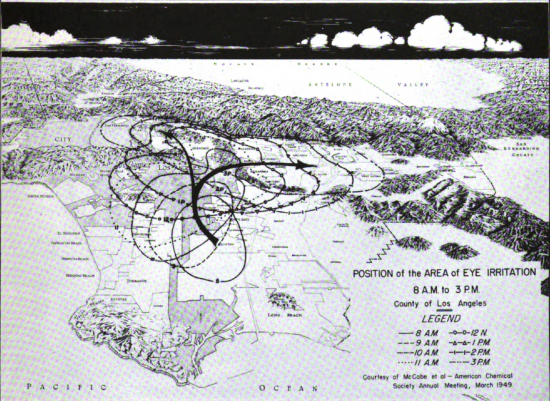
map of eye irritation flows, LA, 1949.
caption: Early efforts at visualizing air pollution trace back to the eye -- eyes, more accurately, in human bodies distributed throughout Los Angeles County communities. It's all about the eyes -- as bio-indicators, and as site of toxic action -- not the lungs. The first and at the time only physiological effect of smog that was mapped was eye irritation. This geography of eye irritation resembles a topographic map, or a map of barometric pressure -- not surprisingly, given that meteorological data was the most collected and readily available data there was. A moving zone of "lachrymation" is tracked over the course of a day, as it slowly shifts north and east, into the San Fernando Valley and towards San Bernardino. The source, or at least the origin of the arrow and the center of the earliest 8 a.m. irritation circle, is Compton.
The map is available today through the Haithi Trust Digital Library.
This visualization is part of the Toxic SoCal collection and Visualizing Toxic SoCal photo essay. It is also part of the Smog in LA, C. 1949 collection and Smog: Visualizations, Effects C. 1949 photo essay.