Frostenson, Sarah and Sarah Kliff. 2016. “The risk of lead poisoning isn’t just in Flint. So we mapped the risk in every neighborhood in America.” Vox, April 6, 2016. https://www.vox.com/a/lead-exposure-risk-map
Sarah Frostenson and Sarah Kliff, "Visualizing Lead Risk", contributed by Alice Chen, Center for Ethnography, Platform for Experimental Collaborative Ethnography, last modified 28 November 2018, accessed 23 February 2025. http://centerforethnography.org/content/visualizing-lead-risk

Critical Commentary
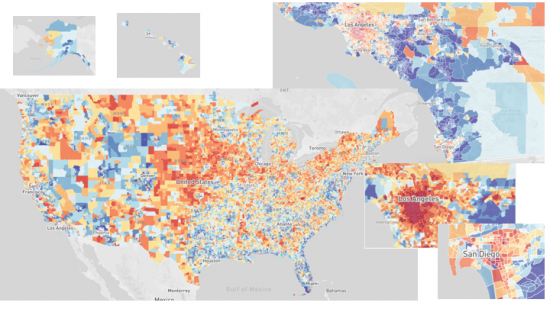
Caption: Lead risk map from Vox (working with the Washington State Department of Health). The researchers used the age of houses (lead paint) and poverty to estimate risk. Lead risk hotspots tend to be concentrated in urban areas (see LA and San Diego), particularly old industrial areas. States with large swaths of rural areas are also more vulnerable to exposure. Maps like this are very rarely created because cities and states are not required to report data on lead poisoning. As a result, there is a gap in knowledge and data. This map attempts to solve this issue by making visible places that are potentially at risk for lead and thus, in need of intervention.
Design Statement: Maps like this are very rarely created because cities and states are not required to report data on lead poisoning. As a result, there is a gap in knowledge and data. This map attempts to solve this issue by making visible places that are potentially at risk for lead and thus, in need of intervention. California, in 2017, passed landmark legislation requiring all health care providers and labaratories to report all results of lead poisoning tests to the California Department of Public Health. Rectifying this gap in data is crucial to raising awareness on lead poisoning as more resources can be distributed to places with more instances in lead poisoning. However, at the current moment, there is no nationwide mandate to report and as a result, healthcare providers and the public are not aware of the amount of instances of lead poisoning and even the risk for being exposed to lead in their own communities.